
Summary
Summary
Summary
This project was an individual academic project, aimed at visualising expenditure data in an accessible and intuitive ways,
This project was an individual academic project, aimed at visualising expenditure data in an accessible and intuitive ways,
This project was an individual academic project, aimed at visualising expenditure data in an accessible and intuitive ways,
Duration
Duration
Duration
5 days
5 days
5 days
Category
Category
Category
Creative Coding, Data Visualisation, Interface Design
Creative Coding, Data Visualisation, Interface Design
Creative Coding, Data Visualisation, Interface Design
ABOUT
ABOUT
ABOUT
The project started as a part of course where we had to identify personal problems, and come up with solutions about it. I had a problem with keeping track of my expenditure since I came to hostel. I used to keep a google sheets ledger with all my expenses in the beginning but it got tedious and boring to do it everyday. I tried to explore if I can find any way to make my payments data more intuitive and accessible. After initial thought I came up with a personal expenditure monitoring system that displays colour coded expenditure data as a wallpaper to make it more accessible.
The project started as a part of course where we had to identify personal problems, and come up with solutions about it. I had a problem with keeping track of my expenditure since I came to hostel. I used to keep a google sheets ledger with all my expenses in the beginning but it got tedious and boring to do it everyday. I tried to explore if I can find any way to make my payments data more intuitive and accessible. After initial thought I came up with a personal expenditure monitoring system that displays colour coded expenditure data as a wallpaper to make it more accessible.
The project started as a part of course where we had to identify personal problems, and come up with solutions about it. I had a problem with keeping track of my expenditure since I came to hostel. I used to keep a google sheets ledger with all my expenses in the beginning but it got tedious and boring to do it everyday. I tried to explore if I can find any way to make my payments data more intuitive and accessible. After initial thought I came up with a personal expenditure monitoring system that displays colour coded expenditure data as a wallpaper to make it more accessible.
Problem Statement
Problem Statement
Problem Statement
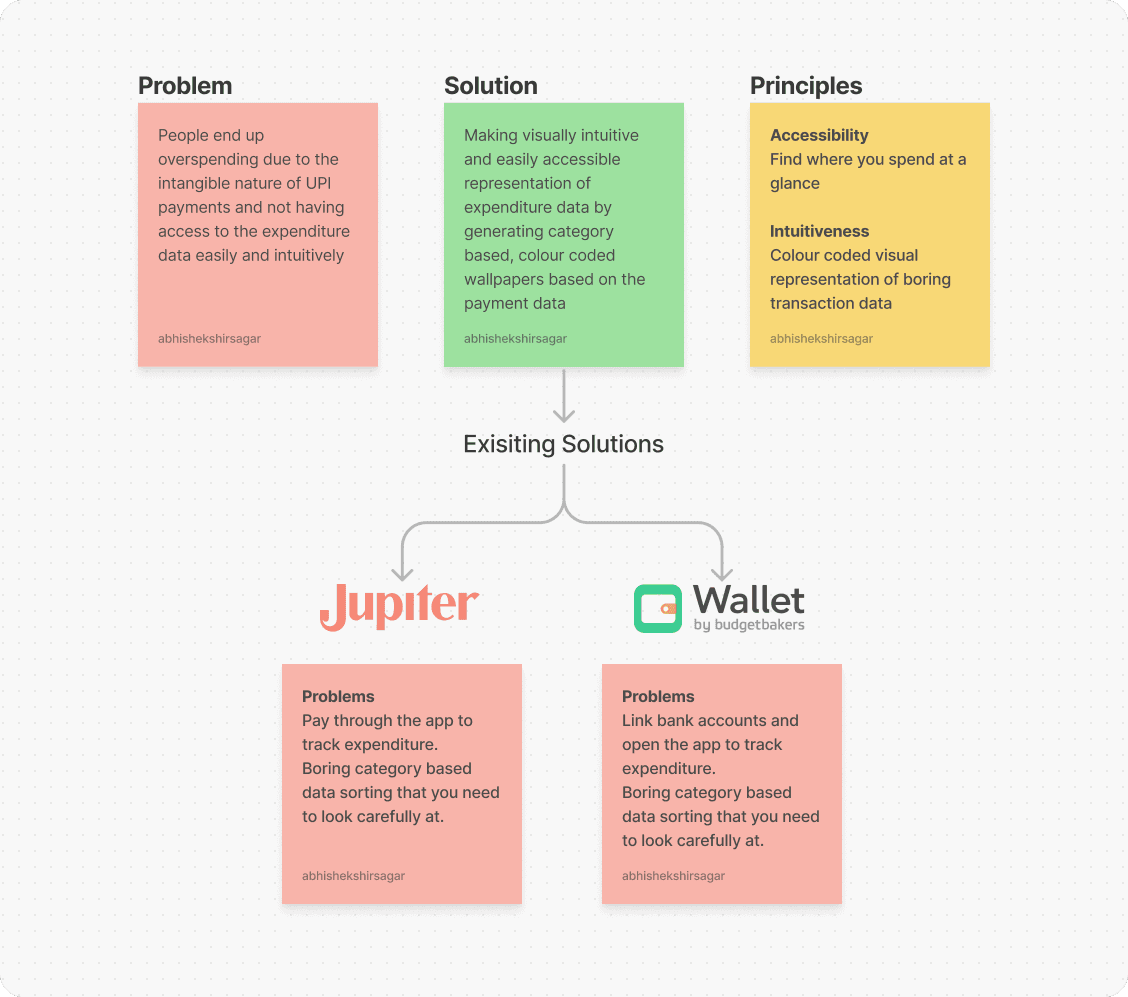
People end up overspending due to the intangible nature of UPI payments and not having access to the expenditure data easily and intuitively.
People end up overspending due to the intangible nature of UPI payments and not having access to the expenditure data easily and intuitively.
People end up overspending due to the intangible nature of UPI payments and not having access to the expenditure data easily and intuitively.
Proposed Solution
Proposed Solution
Proposed Solution
Making visually intuitive and easily accessible representation of expenditure data by generating category based, colour coded wallpapers based on the payment data.
Making visually intuitive and easily accessible representation of expenditure data by generating category based, colour coded wallpapers based on the payment data.
Making visually intuitive and easily accessible representation of expenditure data by generating category based, colour coded wallpapers based on the payment data.
BACKGROUND STUDY
BACKGROUND STUDY
BACKGROUND STUDY
Then I searched for already existing solutions for the same. I found out about applications like Jupiter and Wallet by BudgetBakers. The problem with Jupiter was that it provided expenditure data sorted in categories when you make an payment using that application, but not many people prefer to change their usual UPI application. Wallet uses data from the bank and you don’t have to pay using their application, but the data is still presented in a numeric form and you have to open the application to view the data.
Then I searched for already existing solutions for the same. I found out about applications like Jupiter and Wallet by BudgetBakers. The problem with Jupiter was that it provided expenditure data sorted in categories when you make an payment using that application, but not many people prefer to change their usual UPI application. Wallet uses data from the bank and you don’t have to pay using their application, but the data is still presented in a numeric form and you have to open the application to view the data.
Then I searched for already existing solutions for the same. I found out about applications like Jupiter and Wallet by BudgetBakers. The problem with Jupiter was that it provided expenditure data sorted in categories when you make an payment using that application, but not many people prefer to change their usual UPI application. Wallet uses data from the bank and you don’t have to pay using their application, but the data is still presented in a numeric form and you have to open the application to view the data.
SOLUTION
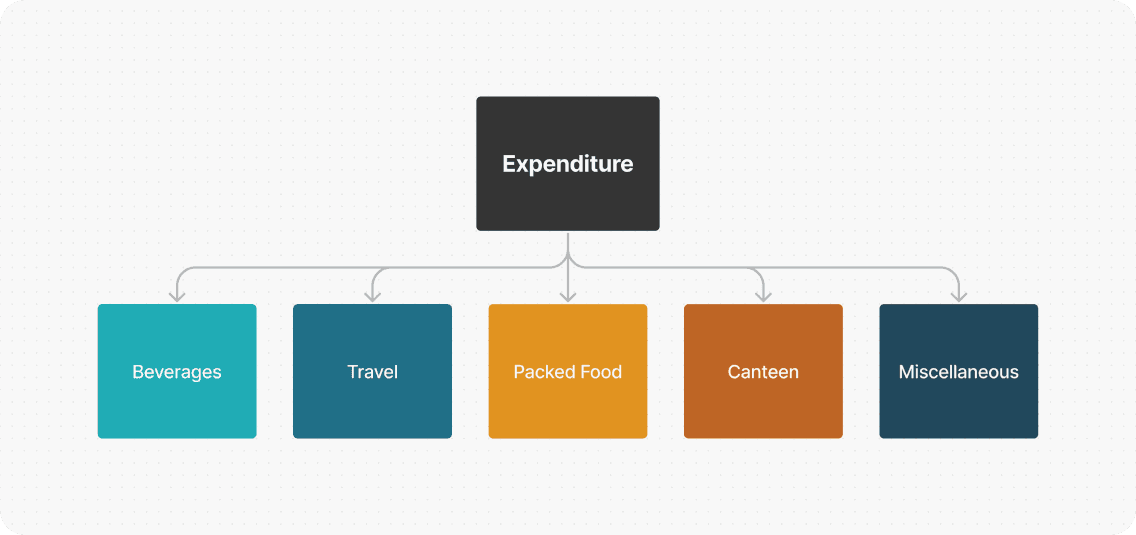
The project started with understanding the nature of my expenditure and categorisation of it into different groups. The categories were beverages, travel, packed food, canteen food and miscellaneous which includes laundry, stationary, clothes, etc. The categories were then colour coded according to a colour scheme that I liked. The categories and colours would be customisable in the final application.
The project started with understanding the nature of my expenditure and categorisation of it into different groups. The categories were beverages, travel, packed food, canteen food and miscellaneous which includes laundry, stationary, clothes, etc. The categories were then colour coded according to a colour scheme that I liked. The categories and colours would be customisable in the final application.
The project started with understanding the nature of my expenditure and categorisation of it into different groups. The categories were beverages, travel, packed food, canteen food and miscellaneous which includes laundry, stationary, clothes, etc. The categories were then colour coded according to a colour scheme that I liked. The categories and colours would be customisable in the final application.
Then I started to work on the implementation of the wallpaper generation. I started to code in p5.js by pulling data from a .csv file. I made some basic patterns that displayed the data using thickness of the colour band used in making the patterns.
Then I started to work on the implementation of the wallpaper generation. I started to code in p5.js by pulling data from a .csv file. I made some basic patterns that displayed the data using thickness of the colour band used in making the patterns.
Then I started to work on the implementation of the wallpaper generation. I started to code in p5.js by pulling data from a .csv file. I made some basic patterns that displayed the data using thickness of the colour band used in making the patterns.
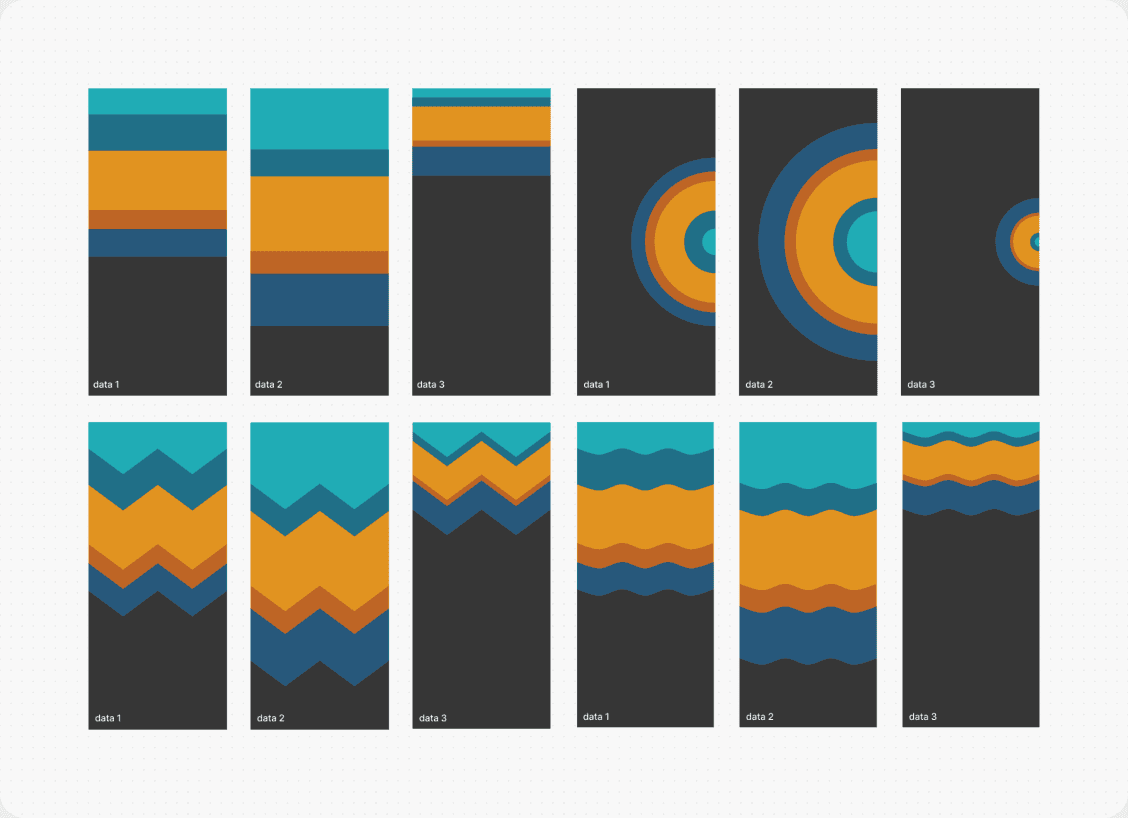
You can generate some based on 4 data sets below.
You can generate some based on 4 data sets below.
You can generate some based on 4 data sets below.
CONCEPT PROTOTYPE
CONCEPT PROTOTYPE
CONCEPT PROTOTYPE
I then started to get into the implementation of the actual application. The users would get a walkthrough of how to set categories and limits, and give data permissions for UPI payments. Then I mocked up a simple prototype of the aforementioned experience on Figma.
I then started to get into the implementation of the actual application. The users would get a walkthrough of how to set categories and limits, and give data permissions for UPI payments. Then I mocked up a simple prototype of the aforementioned experience on Figma.
I then started to get into the implementation of the actual application. The users would get a walkthrough of how to set categories and limits, and give data permissions for UPI payments. Then I mocked up a simple prototype of the aforementioned experience on Figma.
Colophon
Colophon
Colophon
The font used in this project is Proxima Nova designed by Mark Simonson.
The font used in this project is Proxima Nova designed by Mark Simonson.
The font used in this project is Proxima Nova designed by Mark Simonson.
Project Guide
Project Guide
Project Guide
Prof. Ishneet Grover
Prof. Ishneet Grover
Prof. Ishneet Grover
Course
Course
Course
DE231 | Design, Media and Technologies
DE231 | Design, Media and Technologies
DE231 | Design, Media and Technologies